Table of Contents
![]()
![]()
Overview
Color sensing is a crucial aspect of many modern applications, from color detection and sorting in industrial processes to smart home automation systems. The TCS3200 color sensor is a widely used device for color sensing due to its simplicity, accuracy, and ease of integration. To harness the full potential of this sensor, this library was developed, a powerful and user-friendly API that allows Arduino developers to interface with the TCS3200 sensor effortlessly. This comprehensive documentation will delve into the intricacies of the TCS3200 sensor, the algorithm behind the library, and the mathematical equations used to convert raw sensor readings into meaningful color data.
Understanding the TCS3200 Color Sensor
The TCS3200 color sensor is a programmable device that can detect and measure the intensity of light across different color channels. It comes equipped with an array of photodiodes, each covered by a specific color filter: red, green, blue, and clear. The clear photodiode captures ambient light and is used to calculate the overall intensity.
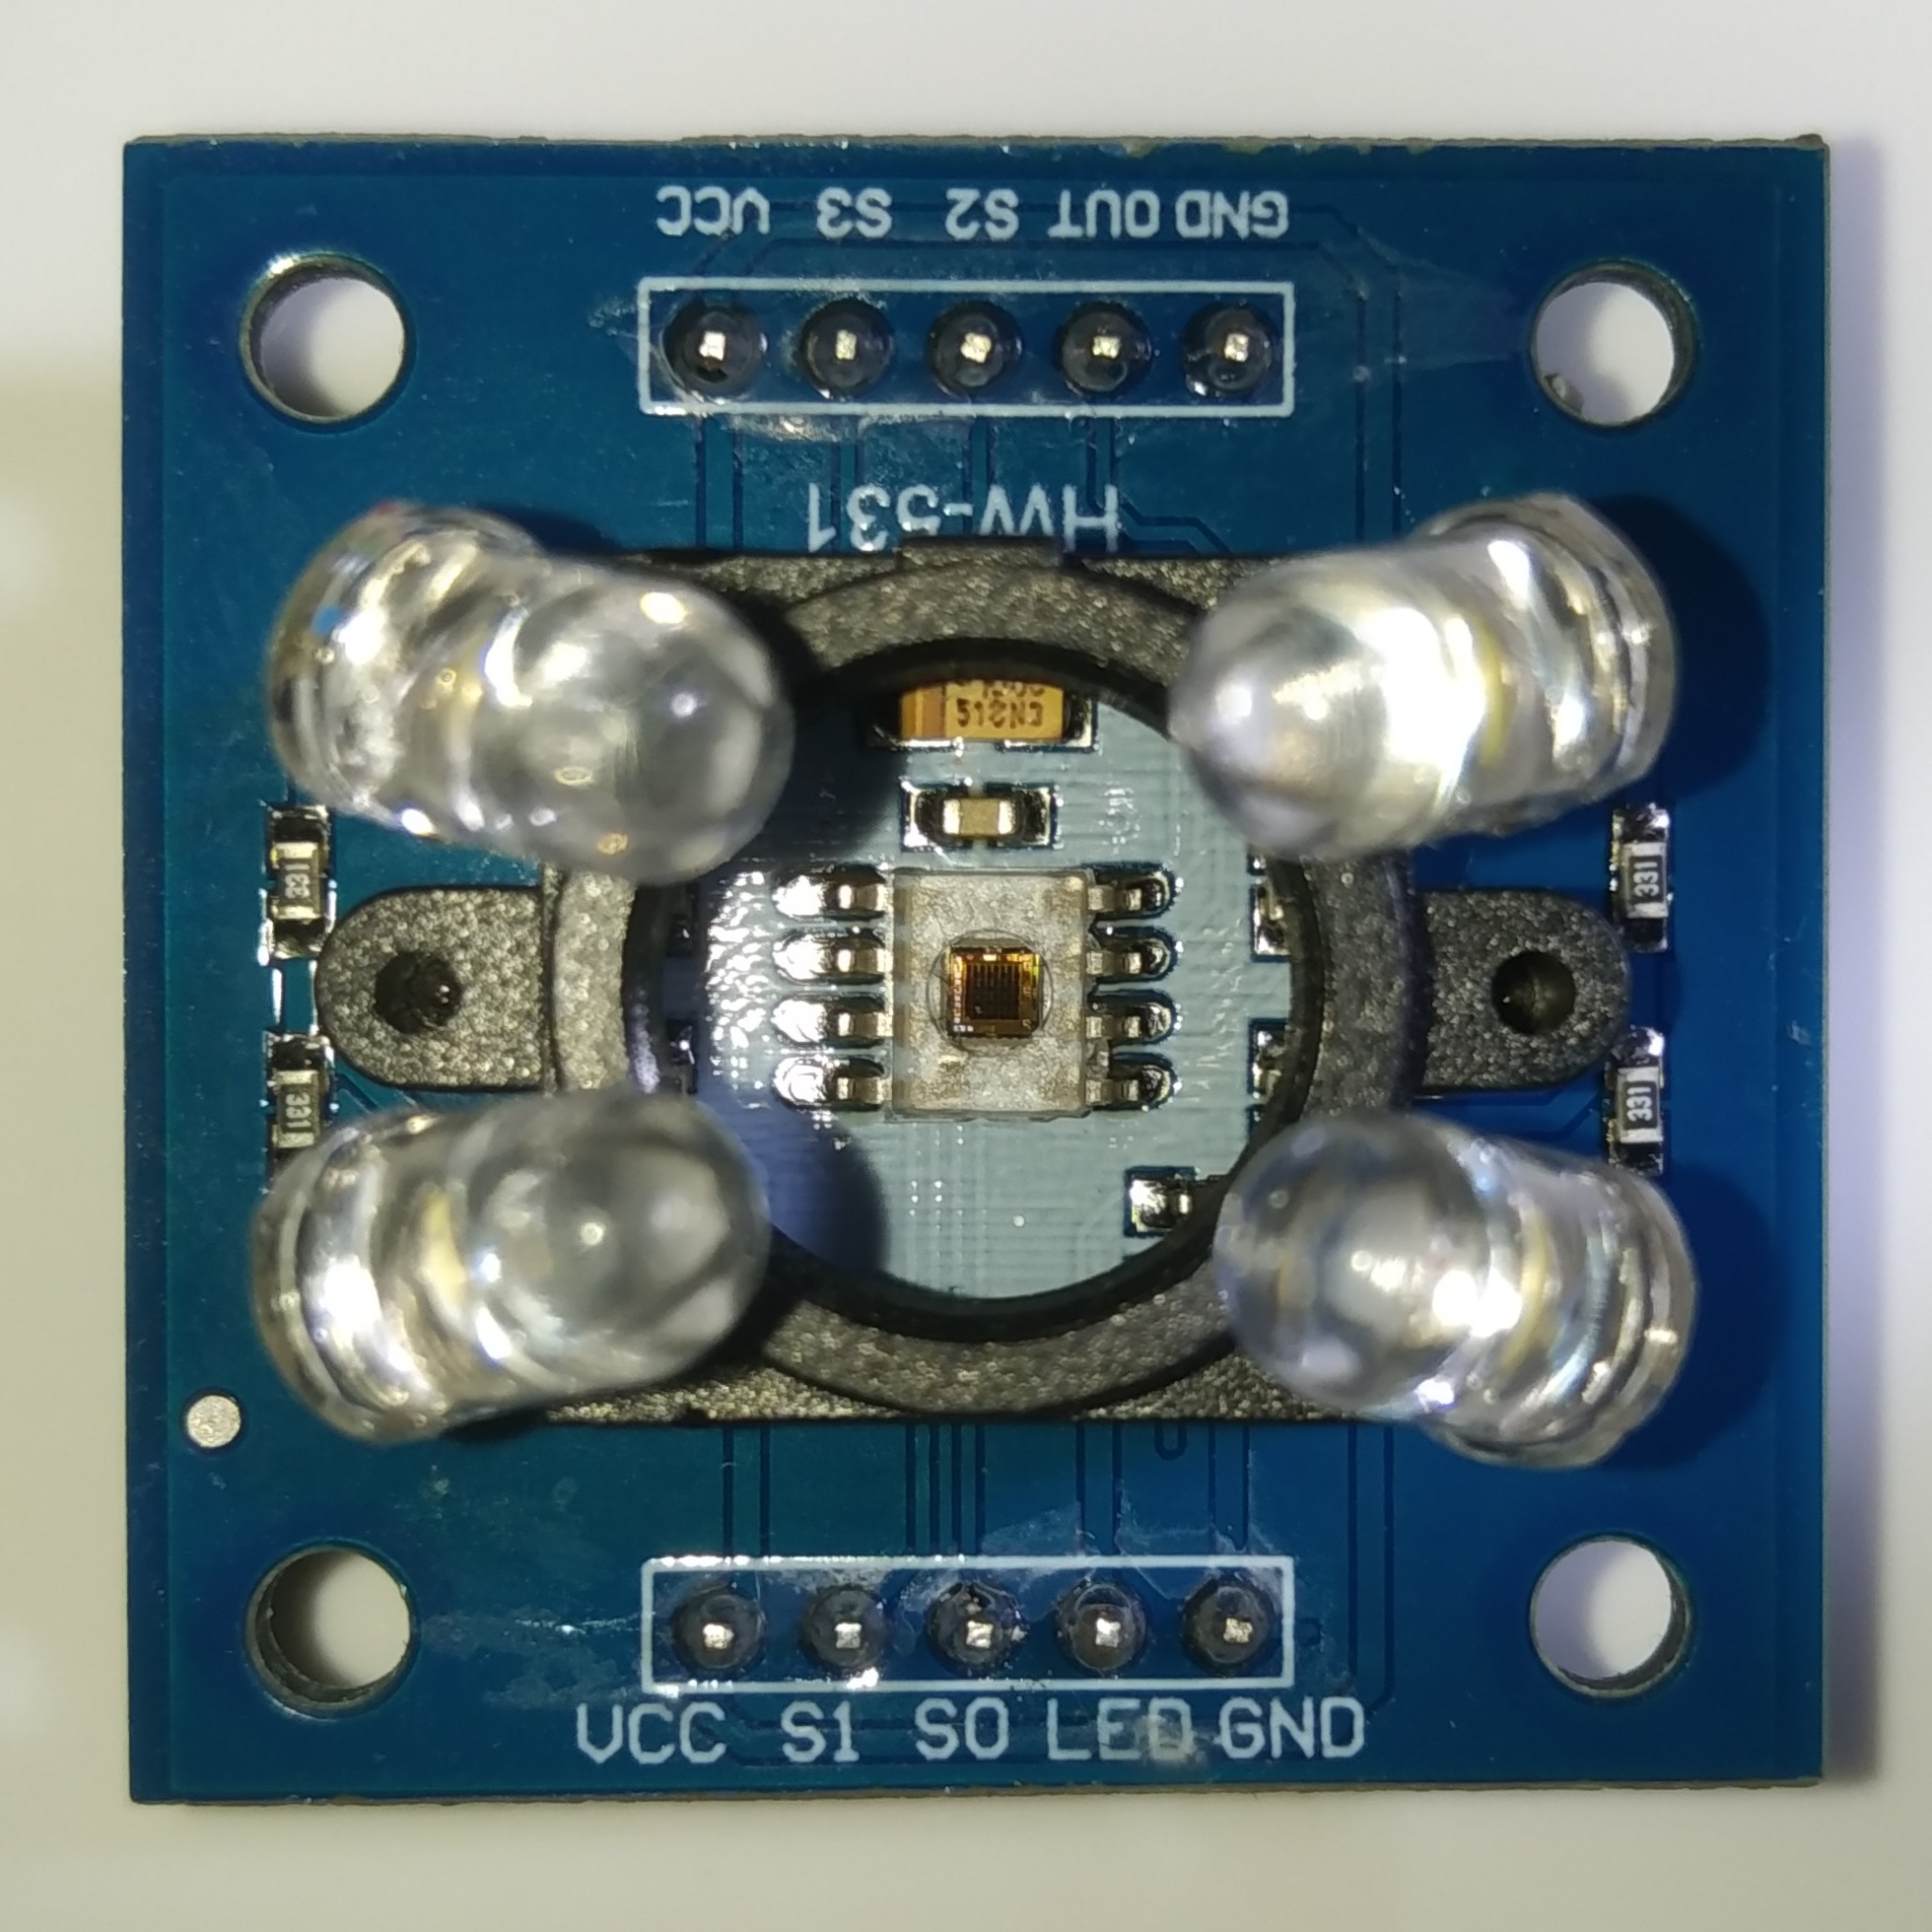
TCS3200 Color Sensor
The sensor has two main operating modes: frequency and analog output. In frequency mode, the sensor outputs a square wave with a frequency proportional to the intensity of light detected. In analog output mode, the sensor provides a voltage output proportional to the intensity.
To achieve accurate color sensing, the TCS3200 library employs both frequency and analog output modes to calibrate and interpret color data. Additionally, the library allows users to customize the integration time and frequency scaling of the sensor to optimize performance for specific applications.
Algorithm Overview
The TCS3200 Arduino Library is designed with simplicity and extensibility in mind. It offers a wide range of functionalities, from basic color sensing to advanced features like white balancing, color space conversions, and nearest color detection.
Here's an overview of the key functions and their roles in the library:
Initialization
The
begin()function initializes the TCS3200 sensor by configuring the necessary pins and setting default integration time and frequency scaling.Color Reading
Access the red, green, and blue intensity values captured by the TCS3200 color sensor. These raw RGB values can be used to analyze the color composition of an object or its surroundings. The library provides four functions to read the intensity of each color channel:
read_red(),read_green(),read_blue(), andread_clear(). The clear channel reading is used for calibration and to calculate the RGB color intensity values.Calibration
Achieve better color accuracy with sensor calibration. The library includes methods to calibrate the sensor in both light and dark environments, resulting in more reliable and consistent color measurements.
The
calibrate(),calibrate_light(), andcalibrate_dark()function enables calibration of the sensor. Calibration involves capturing readings for both the lightest and darkest colors to establish the range for color intensity mapping.Integration Time
Set integration time and frequency scaling to adapt to different lighting environments. The
integration_time()function allows users to get and set the integration time for each color reading, affecting the accuracy and sensitivity of color measurements on calibration. Integration time determines the period for which the sensor collects light data while calibrating.Frequency Scaling
The
frequency_scaling()function gets and sets the scaling factor for the sensor's frequency output to optimize the trade-off between accuracy and response time.White Balancing
Perform white balancing to adjust color measurements for different light sources. By setting the white balance, color readings can be normalized to match the true colors under various lighting conditions, improving the accuracy of color detection. The
white_balance()functions provide the ability to calibrate the sensor based on a known white color.Color Space Conversions
The library offers functions to convert RGB color values to other color spaces such as HSV, CMYK, and CIE 1931 XYZ.
- HSV (Hue, Saturation, Value): Convert RGB colors to the HSV color space. HSV representation provides intuitive and easy-to-understand values for color manipulation and analysis. Hue represents the color, saturation measures color intensity, and value indicates brightness.
- CMYK (Cyan, Magenta, Yellow, Key/Black): Transform RGB colors to CMYK, a color model commonly used in printing. CMYK values represent the amount of cyan, magenta, yellow, and black needed to reproduce the given RGB color accurately on printed media.
- CIE 1931 XYZ (CIE 1931 Color Space): Convert RGB colors to CIE 1931 XYZ color space, which approximates human vision. This color space provides tristimulus values that represent the physiological response of the human eye to light.
Nearest Color Detection
Find the nearest color from a given set of colors. This feature is useful in applications where specific color matching is required, such as sorting objects based on color or identifying color categories. The
nearest_color()template function takes an array of color labels andRGBColorvalues and returns the nearest color label based on the current sensor readings.Upper and Lower Bound Interrupts
Configure upper and lower bound interrupts for specific color thresholds. When the measured color crosses these thresholds, user-defined callback functions can be triggered, enabling real-time color-based event handling.
Chroma Calculation
Calculate the chroma value from RGB readings, providing an indication of the purity and saturation of a color. Higher chroma values signify more vibrant colors, while lower values indicate less saturated or desaturated colors.
RGB Dominant Color
Identify the dominant color from the RGB readings. This feature can be valuable when you need to determine the most prominent color in a scene or object.
Mathematical Equations
HSV Color Space Conversion
The HSV color space represents colors using three components: hue, saturation, and value. The hue component represents the color type (e.g., red, green, blue), saturation represents the color purity, and value represents the brightness.
The conversion from RGB to HSV is achieved using the following equations:
\begin{equation} V = \max(R, G, B) \end{equation}
\begin{equation} \Delta = \max(R, G, B) - \min(R, G, B) \end{equation}
\begin{equation} S = \begin{cases} \frac{\Delta}{V} & \text{if } V \neq 0 \\ 0 & \text{otherwise} \end{cases} \end{equation}
\begin{equation} H = \begin{cases} 0 & \text{if } \Delta = 0 \\ 60^\circ \times \frac{(G - B)}{\Delta} + 360^\circ & \text{if } V = R \\ 60^\circ \times \frac{(B - R)}{\Delta} + 120^\circ & \text{if } V = G \\ 60^\circ \times \frac{(R - G)}{\Delta} + 240^\circ & \text{if } V = B \end{cases} \end{equation}
As can be seen above, the conversion from RGB to HSV involves a series of mathematical operations to extract these components.
First, we determine the maximum value among the RGB color components (red, green, and blue) to obtain the maximum intensity, which represents the value component ( \( V \) ) in HSV. Next, we calculate the difference between the maximum and minimum values among the RGB components, referred to as the color range ( \( \Delta \) ). The saturation ( \( S \) ) is then derived by dividing the color range ( \( \Delta \) ) by the maximum intensity ( \( V \) ), representing the purity of the color.
Then finally, the hue ( \( H \) ) is computed based on the maximum intensity ( \( V \) ) and the color range ( \( \Delta \) ). Depending on which RGB component has the highest intensity, we use different formulas to calculate the hue. This process results in a color representation that is more intuitive for human perception and allows easy manipulation of color properties, making it useful in many applications, including color adjustments and visualizations.
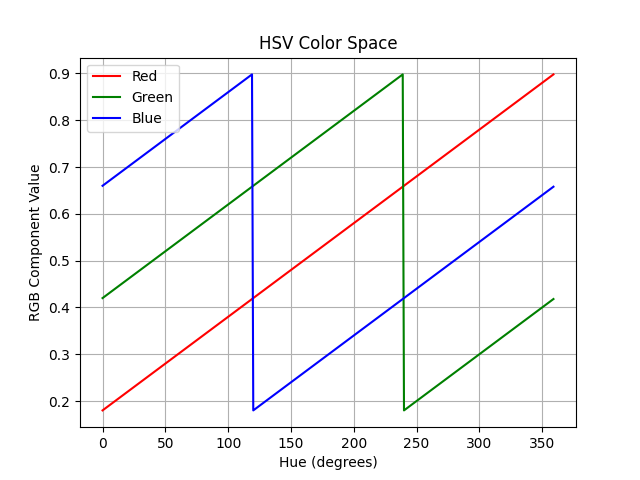
Above, the graph plots the RGB components (Red, Green, and Blue) as functions of Hue while keeping the Saturation and Value fixed. By varying the Hue from 0 to 360 degrees, we can observe how the RGB components change to represent different colors on the color wheel.
CMYK Color Space Conversion
The CMYK color space represents colors using four components: cyan, magenta, yellow, and black. Cyan, magenta, and yellow represent the primary subtractive colors, and black represents the key color.
Moreover, the CMYK color space is commonly used in color printing and represents colors using four primary components: cyan, magenta, yellow, and black. The conversion from RGB to CMYK is based on subtractive color mixing, where the primary colors subtract light from white to create various hues.
\begin{equation} K = 1 - max(R,G,B) \end{equation}
\begin{equation} C = \frac{1-R-K}{1-K} \end{equation}
\begin{equation} M = \frac{1-G-K}{1-K} \end{equation}
\begin{equation} Y = \frac{1-B-K}{1-K} \end{equation}
To convert RGB to CMYK, we first calculate the key color ( \( K \) ) component, which represents the amount of black needed to achieve the desired color. The key color is determined by finding the maximum value among the RGB components and subtracting it from 1. Next, we calculate the cyan, magenta, and yellow components by subtracting the corresponding RGB components from 1 and dividing by the key color ( \( K \) ). This process ensures that the CMYK color model effectively represents the proportions of each primary color required to reproduce a given color on a printed surface.
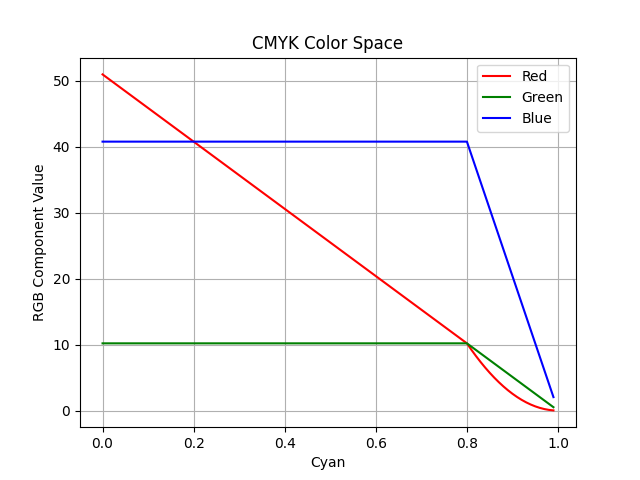
The image above shows the RGB components as functions of Cyan while keeping Magenta and Yellow fixed. By varying the Cyan component from 0 to 1, we can observe how the RGB components change to represent different colors in the CMYK color space.
CIE 1931 XYZ Color Space Conversion
The CIE 1931 XYZ color space is a standard color space based on human color perception. It consists of three components: X, Y, and Z. The conversion from RGB to CIE 1931 XYZ is achieved using the following equations:
Furthermore, this color space is a standardized color model developed by the International Commission on Illumination (CIE) to represent human color perception. It forms the foundation of many other color spaces and provides a device-independent representation of colors.
The conversion from RGB to CIE 1931 XYZ involves a linear transformation of the RGB components using specific weighted coefficients. Each RGB component is multiplied by these coefficients, and the results are summed to obtain the X, Y, and Z components in the XYZ color space.
\begin{equation} X = 0.4124564 × R + 0.3575761 × G + 0.1804375 × B \end{equation}
\begin{equation} Y = 0.2126729 × R + 0.7151522 × G + 0.0721750 × B \end{equation}
\begin{equation} Z = 0.0193339 × R + 0.1191920 × G + 0.9503041 × B \end{equation}
The X, Y, and Z components represent the tristimulus values that correspond to the amount of red, green, and blue light emitted or reflected from a surface under a particular light source. The XYZ color space provides a mathematical model that allows accurate comparisons and transformations between colors, making it an essential tool for color science and various color-related applications.
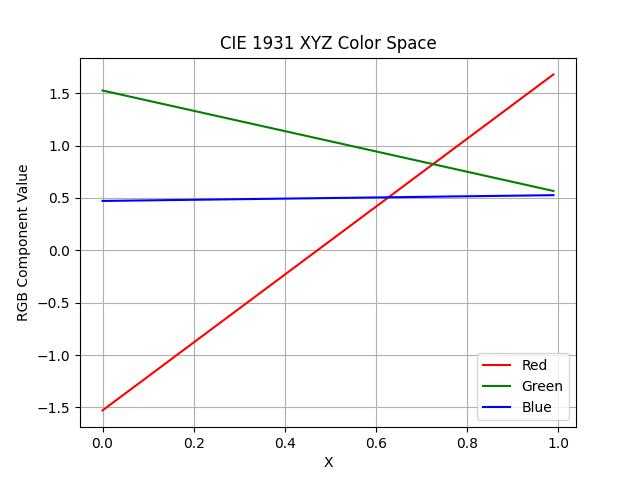
The graph below plots the CIE 1931 XYZ color space conversion from RGB (Red, Green, Blue). Where X, Y, and Z represents the tristimulus values, which are linear transformations of the RGB components. X, Y, and Z are not directly perceptible as colors but are used to derive other color spaces like CIE Lab* and CIE Luv*.
Frequency Scaling
Frequency scaling in the TCS3200 allows users to adjust the sensitivity of the sensor. It controls the duration of exposure time for each color filter and influences how frequently the sensor updates its output frequency. The sensor offers four frequency scaling options, which are selected by configuring the S0 and S1 control pins:
Power-Down Mode (TCS3200_PWR_DOWN)
The sensor is turned off, and the photodiodes do not receive any light. This mode is used when the sensor is not needed to conserve power.
2% Output Frequency (TCS3200_OFREQ_2P)
In this mode, the photodiodes are exposed to light for a very short time (2% of the total cycle time) and produce an output frequency corresponding to the detected light intensity. This mode is useful when very precise color measurements are required.
20% Output Frequency (TCS3200_OFREQ_20P)
The photodiodes are exposed to light for a longer time (20% of the total cycle time) and produce an output frequency. This mode offers a good balance between sensitivity and response time.
100% Output Frequency (TCS3200_OFREQ_100P)
On 100% frequency output, the photodiodes are exposed to light for the entire cycle time, resulting in a continuous output frequency. This mode provides the highest sensitivity but may lead to slower response times.
The appropriate frequency scaling option depends on the specific application and the desired balance between sensitivity and response time. For tasks requiring fast color detection, the 2% or 20% frequency scaling options are preferred. On the other hand, when high precision and sensitivity are essential, the 100% frequency scaling option can be used, albeit with slower response times.
Furthermore, frequency scaling plays a significant role during calibration as well. During calibration, the sensor is exposed to known colors, and the corresponding output frequencies are recorded. These reference frequencies are then used to map the sensor's output to accurate color values during normal operation.
Getting Started
To start using TCS3200 color sensor library in your Arduino projects, follow these simple steps:
- Download the TCS3200 library from the GitHub repository.
- Extract the downloaded archive and rename the folder to "TCS3200".
- Move the "TCS3200" folder to the Arduino libraries directory on your computer.
- Windows:
Documents\Arduino\libraries\ - MacOS:
~/Documents/Arduino/libraries/ - Linux:
~/Arduino/libraries/
- Windows:
- Launch the Arduino IDE.
- Click on
Sketch > Include Library > TCS3200 Color Sensorto include the library in your sketch.
You are now ready to use TCS3200 library in your Arduino projects!
Examples
To access the examples:
- Open the Arduino IDE.
- Click on
File > Examples > TCS3200 Color Sensorto see the list of available examples. - Upload the example sketch to your Arduino board and see the results in action.
Contribution and Feedback
Contributions and feedback are all welcome to enhance this library. If you encounter any issues, have suggestions for improvements, or would like to contribute code, please do so.